Field data collection:
Two conservative, NaCl tracer injection experiments were conducted in the reach on January 16, 2006. The first injection took place in the morning between 7:30 and 9:30 when stream and hyporheic temperatures were cooler, and the second took place in the afternoon between 14:00 and 16:00 when stream and hyporheic temperatures were warmer. The times were selected so that both experiments would occur after the previous day’s peak flow had receded and before the current day’s peak flow had arrived so that flows during the two experiments would be similar. The reach was instrumented with Campbell Scientific 107-L temperature probes and thermocouples at 11 stations. At each station, stream temperatures and thalweg streambed temperatures at 5, cm,10 cm, and 20 cm below the surface were measured every minute for the duration of the experiments.
Stream and hyporheic water samples were collected at a site 3 m upstream of the injection and at sites located 5, 51, 137, and 142 m downstream of the injection. The hyporheic water wells were located next to one another in the thalweg and screened depths of 8 to 12 cm and 23 to 27 cm, and are thus referred to as the shallow/10 cm wells and the deep/25 cm wells, respectively. Background stream and hyporheic samples were collected once every 15-30 minutes. Other stream samples were collected every five minutes for the first hour of the injection, every 15 minutes during the second hour of the injection, and every five minutes again during the hour after the injection was stopped. Well samples were collected every 15 to 30 minutes during the injections and for one hour after the injections stopped. Samples were filtered through 0.45 μm Pall Gelman filter capsules, collected in HDPE plastic bottles, and kept chilled until analysis.
Field sample analysis:
Analysis for chloride was done on a Dionex ion chromatograph by the University of Colorado’s Laboratory for Environmental and Geological Studies.
Model approach:
The One-Dimensional Transport with Inflow and Storage model, OTIS-P (Runkel et al., 1998) was used to model chloride data from the tracer experiments. Four parameters, the transient storage area (As), dispersion (D), the hyporheic exchange coefficient (α), and the main channel cross-sectional area (A) were optimized to simulate chloride concentrations at the 142 m stream site. Because the reach contained few surficial dead water areas, we assumed that the modeled transient storage represented the hyporheic zone.
We used background stream samples at the sites 3 m above and 5 m below the NaCl injection to determine the upstream pre- and post-injection stream chloride concentrations in the model. Background well concentrations all along the reach were used to determine chloride concentrations in the model’s inflow water. To estimate upstream flows for the two experiments, we used a mass balance approach that took into account the known injectate concentrations and flow rates. Because upstream flows were variable, the experiments were modeled under low, medium, and high steady-state flow scenarios with the low and high flow scenarios corresponding to the minimum and maximum of the measured flows, and the medium flow scenario corresponding to the average. Average inflow rates were estimated based on the chloride tracer dilution and then optimized using the OTIS-P model.
Model code used:
The One-Dimensional Transport with Inflow and Storage model, OTIS-P (Runkel et al., 1998) was used to model chloride data from the tracer experiments.

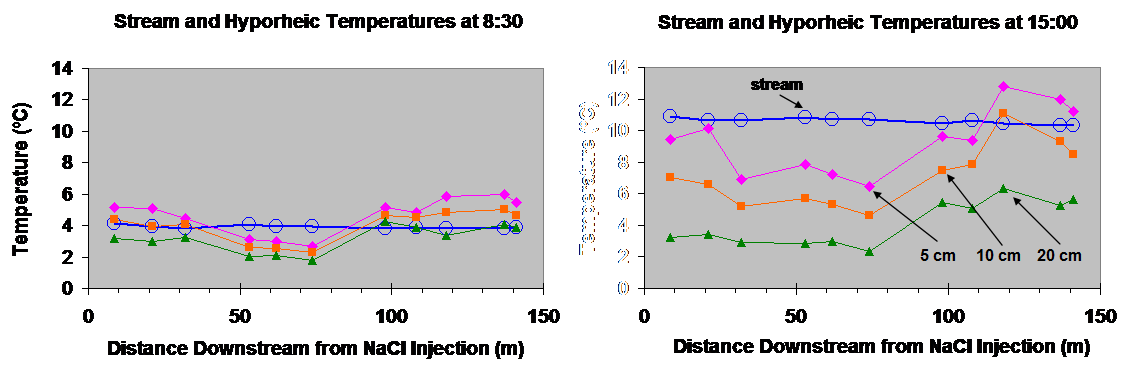 Figure: Longitudinal view of stream and hyporheic temperatures at each of the 11 temperature proble locations at two different times.